
Wix appears in 62% of website builder responses, with an uncertainty range running from 54% to 69%. This range expresses uncertainty around the share measured by Refinea in Italian-language responses, while the observed differences for Webflow show how recommendations vary across the AI engines included in the comparison.
Refinea collected 150 responses on September 22, 2026, across Gemini, ChatGPT and Perplexity, with 50 responses per engine and questions written exclusively in Italian.
How we measured
Refinea queried Gemini, ChatGPT and Perplexity using 25 distinct questions derived from real keywords with measured search volume. The questions contained neither brand names nor simulated personas, allowing us to observe recommendations associated with the requests themselves.
We submitted every question to each engine with 2 repetitions, collecting 50 responses per engine on the same day. Collection took place on September 22, 2026, and every question submitted to the engines was in Italian.
We counted responses recommending each brand, excluding mentions where the brand name appeared in a negative recommendation. The resulting share measures how often a name appears among recommendations, using all responses relevant to that comparison as the total.
For Wix’s overall share, the total includes 150 responses; comparisons between engines use 50 responses for each service. A response can recommend several providers, so different brands’ shares do not represent mutually exclusive portions of the same total.
The 95% confidence intervals express uncertainty around these shares, using a procedure that covers the underlying value in 95% of equivalent repeated samples. We used the Wilson method, which calculates these intervals from the observed occurrences and the total number of responses.
Comparing engines requires identical questions across services and repetitions, followed by separate analysis of each service’s responses. Exact replication also requires the complete question wording and the settings used for every individual query.
Results
The table shows Wix’s overall share and its associated uncertainty range across the full collection of Refinea responses.
| Brand | Share of responses | 95% confidence interval | Total responses |
|---|---|---|---|
| Wix | 62% | 54%–69% | 150 |
This figure describes Wix’s frequency in the collection without establishing a reliable ranking against the other providers. Ranking brands also requires comparing their respective intervals, avoiding firm positions when the uncertainty ranges overlap.
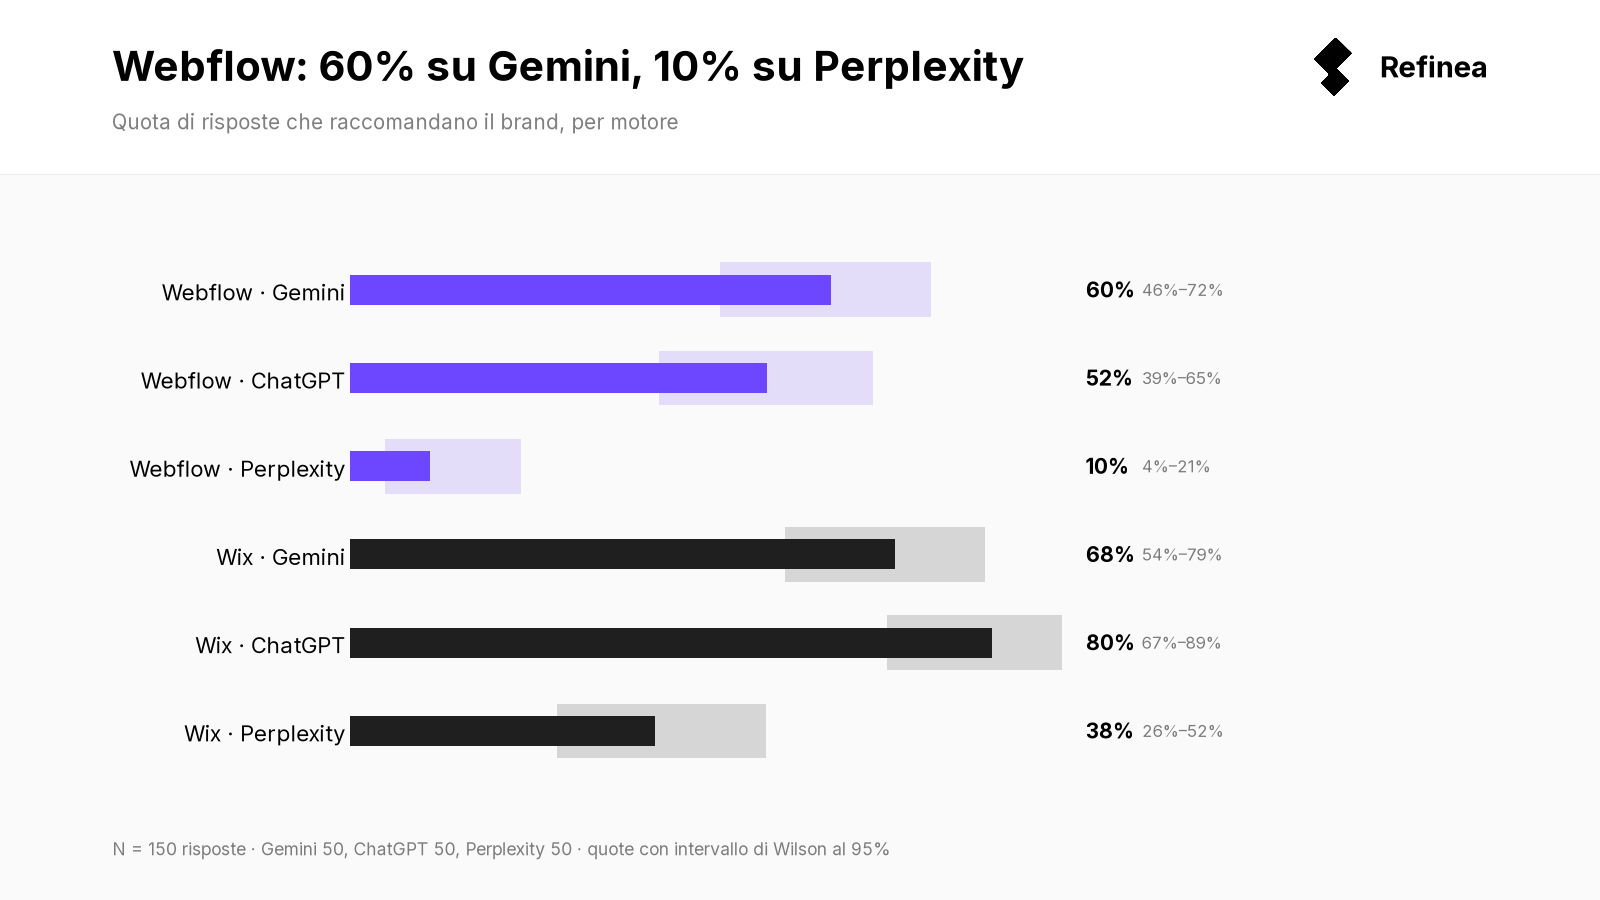
The comparison between engines shows substantial differences for Webflow, which appears in 60% of Gemini responses and 10% of Perplexity responses. Both shares use a total of 50 responses, producing an observed difference of 50 percentage points.
Wix also appears at different frequencies, featuring in 80% of ChatGPT responses and 38% of Perplexity responses, again across 50 responses per engine. Framer’s observed share reaches 32% on Gemini, while its share on Perplexity remains at 0% in this collection.
These differences describe responses collected that day and do not establish stable preferences across engines over time. Framer’s absence from the collected Perplexity responses also does not establish a general exclusion from that service’s recommendations.
Looking at the names occupying the top five positions by frequency, average overlap between engines reaches 59%. This figure describes partially shared shortlists without guaranteeing that any particular question produces the same recommendations.
Overall frequency and comparisons between services therefore answer different questions, both relevant when building an initial shortlist. Keeping these measures separate helps distinguish a brand’s presence across the collection from differences between individual engines.
What this means when choosing a builder
For small business owners, marketing teams and agencies, these results suggest a selection process that keeps differences between engines visible. The collection does not identify a winner for each type of user, because the questions contained no simulated personal profiles.
- Compare Gemini, ChatGPT and Perplexity responses using the same project description, keeping requirements and constraints unchanged. Record which builders recur and which appear only in some responses, without automatically removing the latter from consideration. The observed difference for Webflow illustrates the risk of building an initial shortlist around a single service’s recommendations.
- Turn each recommendation into checks against the work the provider needs to support, separating publishing, updates and content management. A marketing team can directly test the page editing process, while an agency can examine the project handover to its client. These checks address intended use and require evidence from the product, beyond the brand’s presence in AI responses.
- Record the recommended name, the engine’s explanation and the sources readers can actually access as separate fields. Check that each source supports the specific capability attributed to the builder, opening the relevant documentation before including it in your evaluation. A citation provides a reference to examine, but does not automatically validate every claim accompanying the recommendation.
For website builder vendors, the same separation helps distinguish brand presence, reasons for recommendation and cited documents. Agentic optimization moves from measurement to action also describes the move from measurement to operational work, keeping observations separate from interventions.
Limits
The measurement covers 25 Italian-language questions collected exclusively on September 22, 2026, with 2 repetitions per question and engine. The sample captures those requests on that date and does not represent all Italian demand for website builders.
The 25 questions cover three different buying situations: someone running the site alone, someone running it inside a marketing team, someone building it for clients. The results describe that range of needs, not every possible question about website builders.
Repeating the same question reveals variation in responses, but does not broaden the range of needs represented. The reported intervals also express uncertainty around the measured shares without automatically correcting limitations in question selection.
Of the 150 responses, 68% cite at least one source, leaving some recommendations without explicit external references. This figure measures the presence of citations, rather than the completeness or accuracy of the referenced pages.
Fan-out queries, meaning the intermediate searches an engine generates while preparing a response, are available for 52 responses. Within this subset, 60% include a search containing the name of a provider subsequently recommended, with an uncertainty range from 46% to 72%.
This observation covers only responses with visible searches and does not reconstruct the process behind the other collected responses. Finding the name in both the search and the recommendation documents their joint presence, without establishing whether either determines the other.
We measure how often AI engines recommend a name; market share and product quality remain outside the measurement’s scope. Differences affecting small business owners, marketing teams and agencies require dedicated comparisons, with needs explicitly defined in the questions.
Frequently asked questions
Why did you choose these questions?
The questions derive from real keywords with measured search volume and represent Italian-language requests about website builders. Excluding brand names and simulated personas keeps the observation focused on the selected requests, without specifying providers or user profiles in advance.
Why did you compare these engines?
The measurement compares Gemini, ChatGPT and Perplexity to observe how their recommendations change when answering identical questions. The results describe these services on the collection date and do not automatically extend to other assistants.
How should I read an interval?
For Wix, 62% is the observed share, while 54%–69% represents the uncertainty range associated with that estimate. When different providers’ intervals overlap, comparisons require caution and do not support a clear ranking between them.
If you are choosing a builder, consider comparing your initial shortlist against responses collected with identical project requirements.